Wednesday, September 16, 2020

The Great Cyber Comparison: Anthropology of Modern Malware and Development of Civilizations: Part 3 Cyber Global Warming (6 Steps Towards Meltdown)

 Originally published ItSecurityGuru @ https://www.itsecurityguru.org/2015/07/09/the-great-cyber-comparison-anthropology-of-modern-malware-and-development-of-civilizations-2/


I began attending the RSA security conference in the late 1990’s. Back then the show had only a few thousand attendees and security companies were lucky to see a couple of public breaches in the news each year. Not only that, but you could count the companies focused solely on security on two hands – How times have changed! Now there are hundreds of security companies and this year’s RSA attendance hit a record 33,000 people. The show filled not just one side of San Francisco’s Moscone Center, but both sides– a feat few other shows have been able to do.
lot has changed in the security space over the last ten to fifteen years. I know that seems like a long time, but the Internet is changing so rapidly that we do not yet even fully understand all the ramifications that these changes bring. In John McWhorter’s TED2013 talk: Txtng is killing language. JK!!!, he states that, “if humanity had existed for 24 hours, then writing only came along at about 11:07 p.m.” If we were to include the Internet in that analogy we would be looking at 11:59 PM with some small fraction of seconds Left in the day.
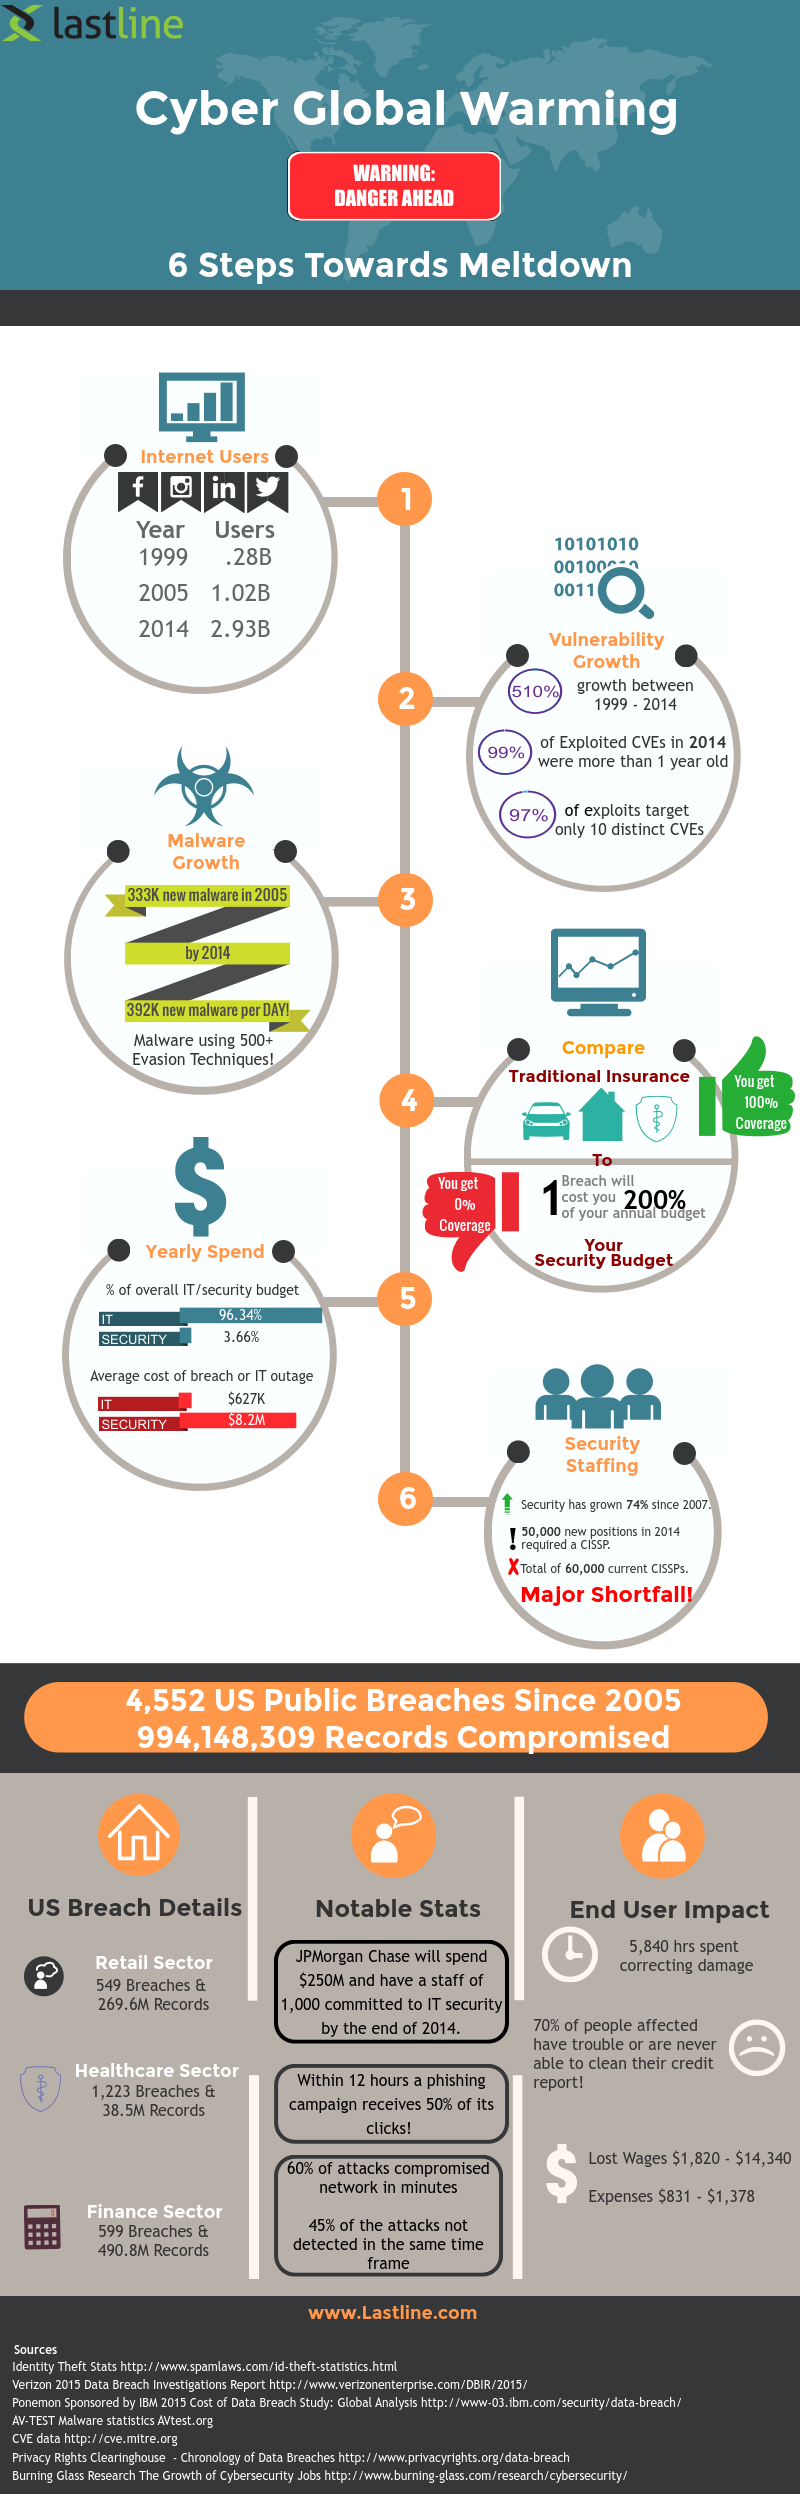
These changes are very similar to the factors covered In, Guns Germs and Steal. Jared Diamond covers a chain of causation leading up to proximate factors (guns, horses, diseases, etc.), which drove the overall growth in civilization. The six steps outlined in my infographic plot a similar chain of causation for cyber security: Internet users, quantity of vulnerabilities, increase in malware, lack of effective security, lack of security budgets and finally, the lack of adequate security staff. This cybersecurity chain of causation has led to the proximate factors of weaponized malware, data theft, and an escalating digital arms race. Making it possible for attackers to move from indiscriminate untargeted attacks to structured targeted attacks delivering huge financial gains!
Step 1. Population growth in Internet users is the leading motivator of the exponential growth in security issues. In 1997, this 6th edition Internet Yellow pages had “Site descriptions and links to 10,000 sites”. In 1999, the number of Internet users was 280 million. By 2005, this number had grown to just over one billion and by 2014 there were almost three billion! This explosive growth in users went hand-in-hand with the growth of websites and countless new services looking to hop on the Internet bandwagon, including search engines such as Yahoo and Google.

Untitled
Step 2. Along with the growth in Internet users, there has been a huge increase in the number of vulnerabilities (a bug or weakness in software that can allow attackers to access to your information and steal your data). In the nascent days of security, vulnerabilities were not even tracked. Instead we related to them based on the interesting names given we gave them, like “OOB” and “Son of OOB”. As more vulnerabilities were found and exploited, they were given numbers and tracked through the Common Vulnerability Exchange (CVE) at Mitre. According to those CVE stats, since 1999 the number of vulnerabilities has grown by 510%. Many of those required a software update to be patched — a slow and difficult process. And considering the large number of machines needing a patch, this is certainly a daunting task! Like most unpleasant tasks, the patching of machines is often deferred, leaving who knows how many machines open to attack. Attackers aren’t being clever when they target old vulnerabilities today; they’re being practical. 99% of the exploited CVE in 2014 were more than a year old! Attackers are saving their zero days (vulnerabilities that are not public) for special targeted attacks or for selling on the blackmarket.
Step 3. In previous entries I talked about how initial virus infections spread via floppies. While malware capabilities have increased, so have their sheer numbers. Let me take you back again to the late 1990’s. There were a number of incidents when I found a file infected with a new virus. I actually walked down the block to McAfee, presented them with the file and chatted while they gave me a new build of their software to clean it. Of course, that was then and this is now. The numbers of new malware today make that process impossible. In fact, I don’t think many would disagree that signature-based AV is long dead! Avtest.org keeps track of the amount of new malware each year. In 2005, there were 333K new pieces of malware. By 2014, this number had grown to 392K pieces of new malware PER DAY! And today’s malware is much more aggressive and deadly. In 2014, Lastline detected malware that combined to use over 500 different evasion techniques! Stay tuned for the weaponization of malware in my next blog segment.
Step 4. Almost everyone has some form of insurance: house, automotive, life, medical, etc. These types of coverage all have one thing in common that security budgets do not – they are 100% effective. As an insurance holder, you pay a premium and (within the limits of your policy) you are covered. Most companies have a multi-layered security plan with budget set aside for a number of different products, services and staffing. While insurance is paid in case there is an issue, the security spend is prophylactic against a breach. Based on the average security budget and the cost of a breach, handling one single breach will cost the targeted company an additional 200% of what they already spent on security.
Step 5. Not only is the cost of a breach out of sync with what is spent on security, we have a similar disparity with the overall IT budget. There is a huge chasm between what is spent on traditional IT and Security. Of the overall IT budget, 96.34% is spent on traditional IT, with just 3.66% spent on security.hat is not a typo—3.66%! And the numbers flip when we contrast how much an IT outage costs compared to a security breach. The average breach will cost $8.2M in lost revenue and additional costs.An IT outage? Only $627K. So here’s the obvious question – why aren’t we spending more on security?
Step 6. The massive adoption of the Internet has required whole new skills sets in IT, networking and security. Unlike other fields that have had decades to mature, these roles have grown so quickly that there has not been time for the market to adapt. I bet you can guess which one has suffered the most – Yes, security. Job postings in the security space have grown 74% since 2007. In 2014 alone, 50,000 new job postings required the applicant to have a CISSP certification. There are currently only 60,000 CISSP holders available, most of whom aren’t looking for a new job! Complicating the issue further are hiring managers who lack the understanding to properly vet applicants.
Security is currently in a state of near meltdown. Just Google the Sony or Target breaches – anyone can see the impact. The Target breach was not some new cutting-edge attack. Target even had a product deployed that detected the attack. Had the product been configured properly it may have stopped the leak of 40M credit cards, but the ALARM went unnoticed! Qualified security employees are a fledgling species. Since 2005 there have been 4,552 public breaches in the US with 994,148,309 (yes, almost a billion) records being compromised! With adequate resources, it’s anyone’s guess how many of those could have been prevented. Rather than stabilizing, the problem is accelerating. The billion-dollar question is how do we adjust priorities and budgets, and encourage people to get educated in cybersecurity? Something has to change if we have any hopes of reversing the trend!
Brian Laing is an executive at IT security innovator Lastline.  An entrepreneur and on the frontline of the security industry for more than 20 years, Brian is a leader in strategic business vision and technical leadership, shown through his work with a range of start-ups and established companies.  Brian founded RedSeal Networks as well as Blade software, who released the industry’s first commercial IPS/FW testing tools.
6StepsInfographic

The Great Cyber Comparison: Anthropology of Modern Malware and Development of Civilizations: Part 2 The First Signs of Weaponized Malware

Originally published ItSecurityGuru @ https://www.itsecurityguru.org/2015/06/09/the-great-cyber-comparison-anthropology-of-modern-malware-and-development-of-civilizations-the-first-signs-of-weaponized-malware/

Jared Diamond states, “By selecting and growing those few species of plants and animals that we can eat, so that they constitute 90 percent rather than 0.1 percent of the biomass on an acre of land, we obtain far more edible calories per acre.” This greater density of plant and animal domestication directly led to denser human populations. Likewise, the increase in Internet use directly gave attackers far more attackable machines per network. The ubiquitous nature of Internet usage also increased the number of attacks by adding new attack paths via a plethora of new Internet services such as social networks.

Malware has always taken advantage of the human enthusiasm to share with one another. In the early days of the Internet both digital content as well as inadequate pathways limited our ability to share. Now with increased Internet use there is a superabundance of new content and many ways for it to be shared. Social networks greatly aided our desire to share – Everything from the mundane, “At Starbucks getting a coffee”, to the two billion daily photos shared on Facebook is fodder for our friends. But social networks are not just for fun and games; they are also utilized as key tools in business. Use of social networks not only facilitates the maintenance of social connections, they also extend those connections to broader second and third order interactions, which further increase the potential attack surface while adding even more new avenues of attack.
One way attackers have taken advantage of these increases is by changing the method of malware proliferation. Early malware spread via floppy disks and targeted users indiscriminately, which limited their infection rate. This also meant they could really only be used for destructive purposes. As the need for knowledge bases grew, intranets and extranets became common throughout corporate networks; malware matured and had new pathways to propagation. Initial Worms spread just as indiscriminately as the less-sophisticated malware, but spread far more rapidly. This was malware’s first major evolutionary step forward.
The Morris worm was one of the first computer worms distributed via the Internet instead of floppy disks. Its father, Robert Tappan Morris released the worm on November 2, 1988 (from an MIT server to disguise the fact that he was a graduate student at Cornell) ostensibly to find out how big the Internet was by gauging how many computers were connected to it. While his goals may have been altruistic, the code exploited known vulnerabilities. And worse, it had a bug! The worm failed to ask whether the worm was already installed on the host machine, so it kept replicating itself until the machine would slow down to the point of being useless. Robert Morris actually did break the Internet. Cleanup of the various networks connected into its backbone took several days, and although Morris has always sworn that his goal was not to cause damage, he was rewarded with a conviction for computer fraud for his effort.
Fast-forward fifteen years to January 25th, 2003 and the Internet had almost a quarter of a billion users. This was the day Michael Bacarella, posted a message to the Bugtraq security mailing list entitled, “MS SQL WORM IS DESTROYING INTERNET BLOCK PORT 1434!“ SQL Slammer had been initiated and almost all of the 75,000 victims were infected within ten minutes. The worm was a very small piece of code that exploited a vulnerability in Microsoft SQL Sever. It would generate random IP addresses and send itself to each of them. If the IP address was an unpatched Microsoft SQL Server, then that server also became infected and would begin to replicate the worm. Two primary aspects drove SQL Slammer’s rapid propagation: the worm infected hosts over UDP, (a sessionless protocol) and the entire worm was just 376 bytes in length, which meant it fit into a single packet and allowed infected hosts to “Fire and Forget” large numbers of packets as rapidly as possible.
Like the Morris worm, SQL Slammer had unintended consequences and set off a chain reaction that was probably more severe than the worm itself. More Internet connected machines equaled more networks and these networks connected via routers. As the worm spread these routers became overloaded, which under normal circumstances would cause the routers to delay or temporarily stop traffic, but instead many of them crashed. When a router crashes their neighboring routers update their routing tables to remove the crashed router. This flood of routing table updates crashed additional routers. But then the crashed routers started to come back online, which caused additional waves of routing table updates, but this time for routers coming online, which only compounded the problem. Other worms such as Mydom and Sasser could spread from machine to machine. Some caused issues that took longer than SQL Slammer to remediate, but SQL Slammer is still recognized as the most virulent and fastest-spreading worm ever.
In 2005 the first warnings from UK and US Computer Emergency Response Teams (CERT), organizations were being sent out to their subscribers. Malware was being tailored and delivered via socially engineered email in the hopes of infecting highly-targeted machines and organizations. The term “Advanced Persistent Threat” or APT had not been created, but the first examples of a new form of evolved malware had arrived. This evolutionary step forward would change security more than anything else. To cover this in detail we need overall context to fully understand the motivations and technology changes that allowed malware to take this step. This requires a review of other forms of attacks such as phishing attacks and traditional service based attacks along with how these attacks are used.

The Great Cyber Comparison: Anthropology of Modern Malware and Development of Civilizations Part 1

Originally published ItSecurityGuru @ https://www.itsecurityguru.org/2015/05/27/the-great-cyber-comparison-anthropology-of-modern-malware-and-development-of-civilizations/

In his Pulitzer Prize-winning Guns, Germs and Steel, Jared Diamond investigates 13,000 years of human society and how it unfolded differently across the continents. He poses questions such as, “Why didn’t capitalism flourish in native Mexico, mercantilism in sub-Sahara Africa, scientific inquiry in China, advanced technology in Native North America, and nasty germs in aboriginal Australia?” Mr. Diamond concludes that the key differences in how society evolved was due to continental environments and not human biology.

Features of a complex society, such as advanced technology and centralized political organization emerged only in dense, sedentary populations that were capable of accumulating food surpluses. Those wild animal species suitable for domestication were consolidated in just nine small areas of the globe, so it made sense that the earliest signs of the rise of agriculture appeared in these areas. And all of them were in close proximity to those dense and lazy populations.
The modern technology of the day, guns, horses, and diseases enabled the more evolved societies to conquer the lesser-developed and more spread out populations. Cybersecurity has similar points in its history where leaps in technology and service adoption created opportunities that triggered evolutionary events in cyber attacks. Two disparate evolutions, civilization and cybersecurity are similar upon closer questioning: “Why does malware tend to originate from only a few geographical areas? How did mass adoption of the Internet and online services impact cybersecurity? And what drove the already destructive virus industry to evolve into targeted malware that can bypass many of today’s defenses as they zero in on their victim?
In 1988, when the Morris worm was written, it was estimated that there were sixty thousand computers connected to the Internet. With its small attack surface (number of potential targets) the damage caused by the Morris worm was tiny compared to our current risk.  According to Cisco somewhere between eight to ten billion devices are connected to the Internet today. Our current potential attack surface has grown from the population of a mid-size suburb to more than the entire population of this planet!! In 1995 only one percent of the world’s population had an Internet connection—now that number is close to 40 percent. The coming growth from the explosion of the Internet of Things will grow this exponentially more: Gartner is forecasting twenty-five billion connected devices by 2020!
Untitled
Source: Internetlivestats.com
So, what has all this growth caused? A new generation of devices with unknown vulnerabilities; an increase in the number of users with Internet connected devices who do not know their machines are at risk; an increasing exposure gap between when a vulnerability is known and when a significant number of users have patched it; a growing attack surface that offers attackers a smorgasbord of low hanging fruit. Ultimately it just may have to be the weight of our own innovation that forces us to sit up and take cybersecurity seriously. The Internet of Things is growing at an alarming (depending upon your perspective) rate. Don’t misunderstand me, innovation is the root of my life and I love my gadgets that help fund Kickstarter projects. But irony is co-pilot to these “Things” that make our lives easier—all it takes is a piece of code to be delivered to one of these products, and suddenly our lives have become much more difficult.
Cyber attackers are a fast-moving, adaptable bunch, and so are their tools. Attacks have changed in a multitude of ways to take advantage of the growing attack surface, but so have the technologies in place to prevent them. When we stop to consider how far the digital age has driven technology and its adoption, it shouldn’t be a surprise that the technology behind those pesky viruses from the late 80s have evolved into behemoths that are capable of taking down multinational corporations or even governments. The surprise will be whether we are capable of stopping them.  More on how attacks have evolved in upcoming segments.

Friday, September 11, 2020

The Evolution of Go-To-Market - How Do You Enable Partners


My earlier posts suggested some non-traditional characteristics by which to select and measure your channel partners.  These only scratch the surface.  Future posts will continue to recommend additional traits to examine, some of which will be contributed by former colleagues.  Once you engage the right partner, you still need to support them with the right team, enablement, and coaching.  In this post, I’ll focus on the famous quote, “eighty percent of success is simply showing up”, which thanks to Jarrett Miller, I will now forever refer to as the Pacman Principle.  What is the Pacman Principle?  Partners need to see you, and they need to know that if they stumble both you and your team will be there to support them.  That is our eighty percent showing up, which in a rotated pie chart (see image to the right) looks like Pacman, hence the Pacman Principle. 


Pacman Principle

 “Eighty percent of what?” I hear you say. Exactly. Most people agree that just showing up equates to eighty percent simply because a gut level it sounds right, but they will not be able to quantify the value of the Pacman Principle or what showing up covers.  In talking to channel executives across the world, I often hear that eighty percent is measured as if it were data from a single event.  Some have even told me that they feel they hit eighty percent by merely signing up a partner; A sort of build it and they will come approach.  I disagree.  To paraphrase Winston Churchill, we need to go back to our partners time and time again!


“If you have an important point to make, don't try to be subtle or clever. Use a pile driver. Hit the point once. Then come back and hit it again. Then hit it a third time a tremendous whack.” 

–Winston Churchill


The impact of the Pacman Principle is not an arbitrary, subjective measure.  The effects of following this principle can be quantified at a basic level.  Even basic measurements, when taken over time, can easily show the impact that the Pacman Principle can have.  The more effort you put into measuring success, the more value you will return.  Look at the success of fitness tracking, where the gamification of tracking fitness has turned it into a multi-billion-dollar industry.  Grand View Research shows the fitness tracking market size as $2.8B in 2018 and growing at a CAGR of 21.1%.  Who says we can’t gamify our partnership management?  One easy starting point is to measure inbound deal registrations over time and correlate them to activities executed with the partner.  With constant measurement, you adjust your interactions until you get the desired results or determine that the partner was a wrong choice.


Let’s look at a real-world example of this in action.  An MSSP partner I was working with had hundreds of salespeople, yet I could only get about ten percent of that sales team to register a deal.  I evaluated this partner using some of the metrics I mentioned in my previous blog posts.  I knew that this partner was a good fit in the services areas (many repeat customers with multiyear service engagements), but they were not as strong of a fit in the product area.  My evaluation found that the trust their customers had in them was very high.  Customers would take new services purely because the vendor recommended them, however, this was not enough to compensate for their lack of experience in selling products.  This partner was not just inexperienced in selling new products to existing customers, they also had an overwhelming amount of built-up muscle memory selling services geared towards SOC efficiencies. 


Determined to make a change, my team and I went on a Pacman campaign.  Typically, when channel account managers call on a partner’s sales team, they ask about specific deals or look to map account activity.  We spent three weeks doing nothing but talking with the sales reps. We did not try to map deals, we did not ask them what they were going to sell that quarter—we simply made sure they had everything they needed to sell confidently!  We wanted to be sure they understood the problem space, not just our product.  Many of them told us they did not feel adequately educated on advanced threats or our product, and as a result, they did not pitch it to their customers.  We also found that they missed clear indicators from their customers that not only did they need our solution but were actively looking for it.  Simply put, the sales staff was not fully enabled.  We had enabled the partner's marketing and product management teams, then sat back and relied on those teams to educate the partner’s sales team on our products.  This lack of direct enablement appeared to be why we were stuck with only ten percent of the sales team registering deals.  After we dug deeper we discovered the proof that we were on to the right track: the ten percent who had registered a deal were salespeople who already understood the problem space from previous positions.


Armed with our findings, we moved from research mode into education mode.  We continued to call on salespeople but now we could offer to join sales calls as a subject matter expert to promote the services they added to the product sale. We offered to join their team meetings to host “Ask Me Anything” sessions and gave them various levels of direct enablement training. One of our more creative solutions was an email alias, PartnerName@Mycompanyname.com.  Now their questions were emailed to my entire team and they did not have to remember any of our names.  We made it simple for them, use this alias to send us an email and the team of people behind it would be there to support them! 


Our seemingly simple offer of help had a significant impact in a very short period.  After just three weeks, we had increased the number of salespeople with a deal in the pipeline from ten percent to forty-three percent.  Now that the sales team felt comfortable talking about the solution and they no longer feared to look foolish to the customer, they started offering the new service, and sales of the new solution began to take off.  This success has generated a few measurement points.  First is the timeliness of a response when the partner emails our alias.  When the partner emails the alias, you must be there to support them, which means being responsive.  If they do not get a timely response, they will not feel supported.  We would have failed to follow the Pacman Principle resulting in the partner moving on to products from other partners.  The other measurement points focus on traditional pipeline metrics.


The anecdote shows that enablement is not a one and done approach, the partner needs to hear from you repeatedly.  If this changes, you can erode all your hard work.  This happened with this very same partner.  Once we had the partner on a trajectory of consistent growth, we were asked to turn the partner over to another team to manage.  The new team did not believe in or follow the Pacman Principle and the impact of this change was seen immediately. You guessed it: we watched our three-quarters of measurable growth turn into three-quarters of quantifiable decline.  The partner was returned to my team, but by that point, they had lost faith in the solution, and we were unable to recover the initial momentum we had built up.


Sabermetrics can help select the optimal channel partners that will enable your company to outplay your competition instead of outspending them!  The key is the ongoing measurement of those metrics.  One of the critical aspects of gamification is a feedback loop; however, stop measuring for too long, and you may have to start over.  The best approach is consistent and ongoing activities with your partners.  Not only will this help accelerate the success of your partners, but it will also help you point out subpar partners that may need replacing or need additional enablement.  In my next post, I will talk more in-depth about the various type of enablement you can deliver to a partner for both their initial onboarding as well as ongoing engagement activities.  Constant, consistent engagement with your partners will help to assure that your company is top of mind and recommended to your partner's customers instead of your partners selling the solution offering the most spiffs.


Thursday, September 3, 2020

The Evolution of Go-To-Market - Evaluating a Partner's Product Offerings


Your goal is to sell products that deliver value to your buyers.  The buyer’s goal is to find and purchase a product that improves their security, or one that offers an equal level of security at a reduced total cost of ownership.  You need a partner that can marry these two goals to the benefit of everyone involved.  There is no shortage of performance indicators that you can examine to determine a partner’s viability.  Start with the basics: financial stability and yearly revenue and then move onto evaluating other aspects such as the mix of products and services.  In my next blog post I will cover how you can engage with partners once you sign them to align synergies and increase your mutual chance of success.  In this post we will look at how the product mix that a reseller partner offers can help determine their suitability as a reseller for your solution. 


Wednesday, September 2, 2020

The Evolution of Go-To-Market - Evaluating a Partner's Service Offerings


In the first part of my Go-to-Market Evolution series, along with the concept of using Sabermetrics (popularized in the film Moneyball) to optimize a company’s channel partner selection, I discussed the overwhelming amount of choice that today’s security buyer faces. 


Baseball is not the only sport applying the principals of Sabermetrics; Liverpool Football Club track a variety of stats for approximately 10,000 players from around the world!  The channel partners that a company signs up are equivalent to a player on a sports team, with each one having as big an impact on a company’s success as any star player on a sports field.  Yet when companies set their go-to-market channel strategy, they rarely look at anything more than superficial indicators of success, such as the number of employees, their yearly sales, and financial stability.  Most of the time when looking at a list of potential channel partners companies usually pick the large, well-known partners and those with whom their channel managers already have relationships.  What if a company hired a channel manager with ties to the wrong type of channel partner?  We are in an age of Data Analytics, Artificial Intelligence and Machine Learning, so why can so few companies answer questions on simple partner stats, let alone looking at the equivalent of “in-game” stats I am proposing, and that make Liverpool Football Club so successful? 


Tuesday, September 1, 2020

The Evolution of Go-To-Market - How Do You Select Partners


A company's chosen go-to-market path has never been more crucial.  With the world rightly focused on keeping people healthy amidst the Covid-19 pandemic, companies must be agile and able to adjust their go-to-market plans when necessary.  Though we are all focused on helping our first responders and keeping our families safe, there is a subset of cybercriminals who are taking advantage of the pandemic by exploiting fear and concentrate their attacks using Covid-19 related messaging.


"You get a very short period of time to execute your intellectual property; you have to execute a go-to-market strategy equally as fast and equally as innovative. 

Dave Dewalt